CIE XYZ color matching curves
For a given wavelength \( \lambda \) (x-axis), the 3 values of the X, Y and Z color matching functions represent the "amount" of the 3 hypothetical light sources that combine to produce a light that is perceived as being a pure light of wavelength \( \lambda \).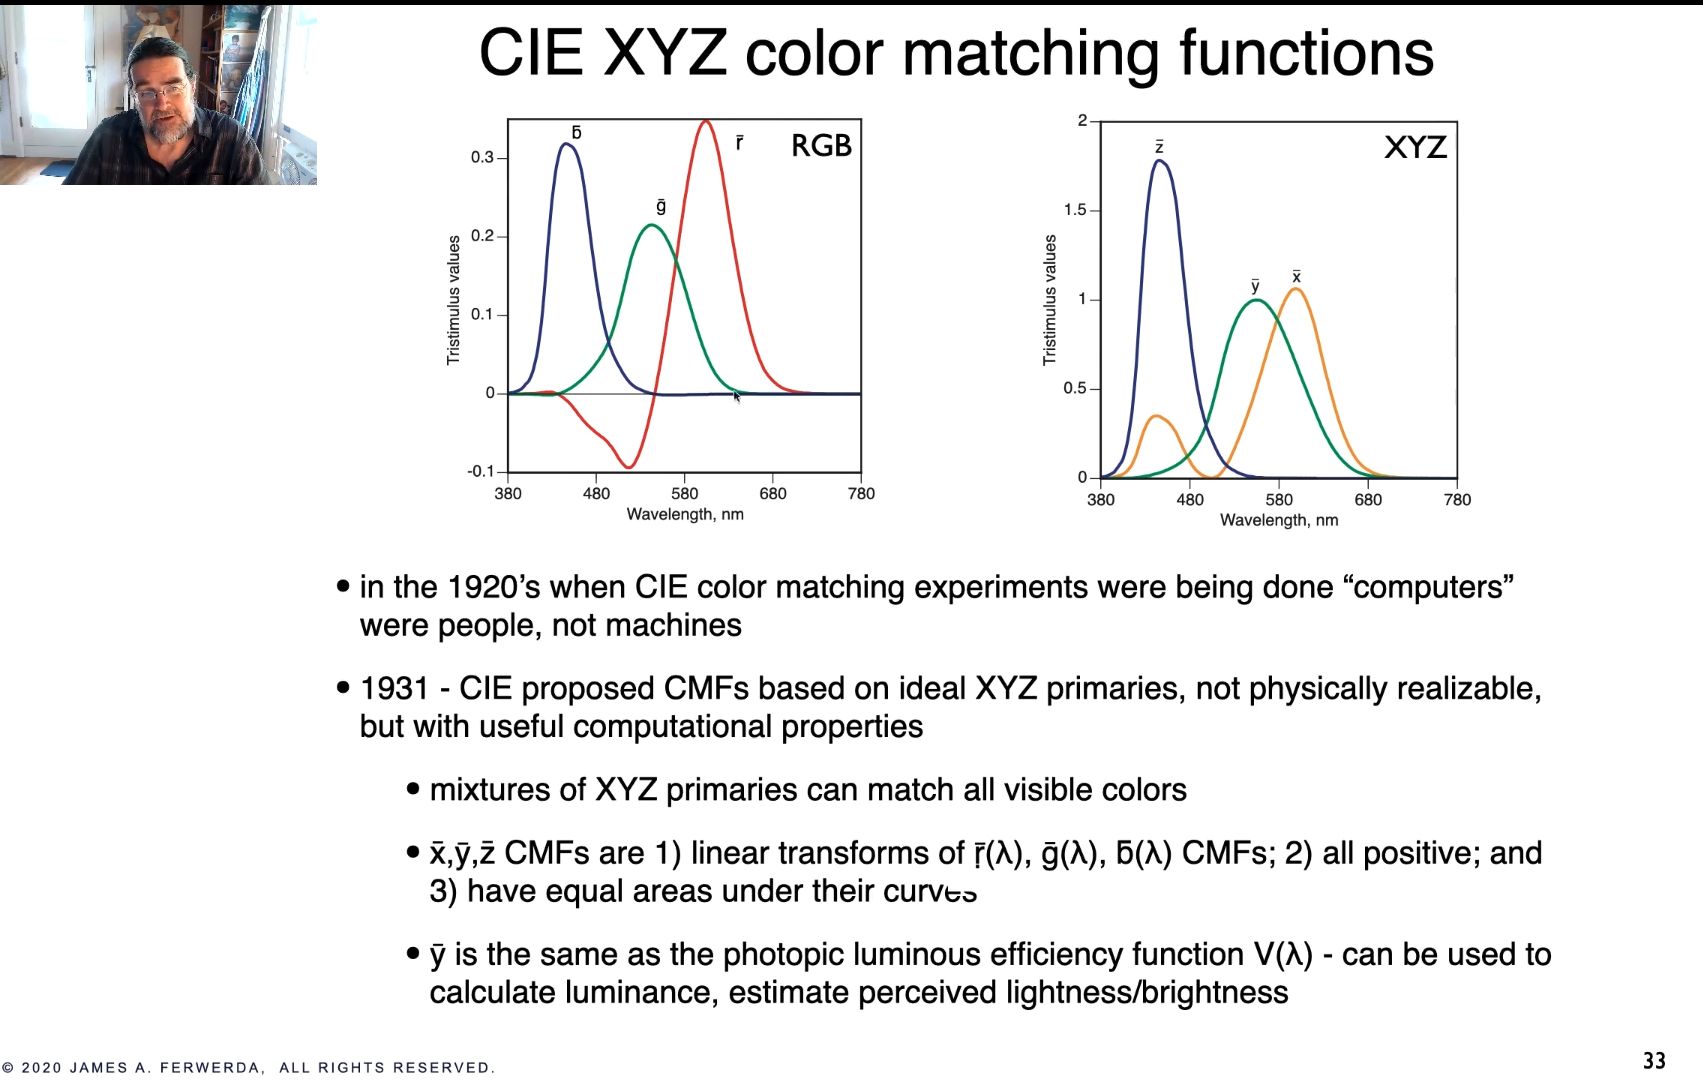
It's interesting to note that the lack of computers motivated the X, Y and Z functions to have the same integral area and for them to all be positive. This enabled easier calculations by humans.
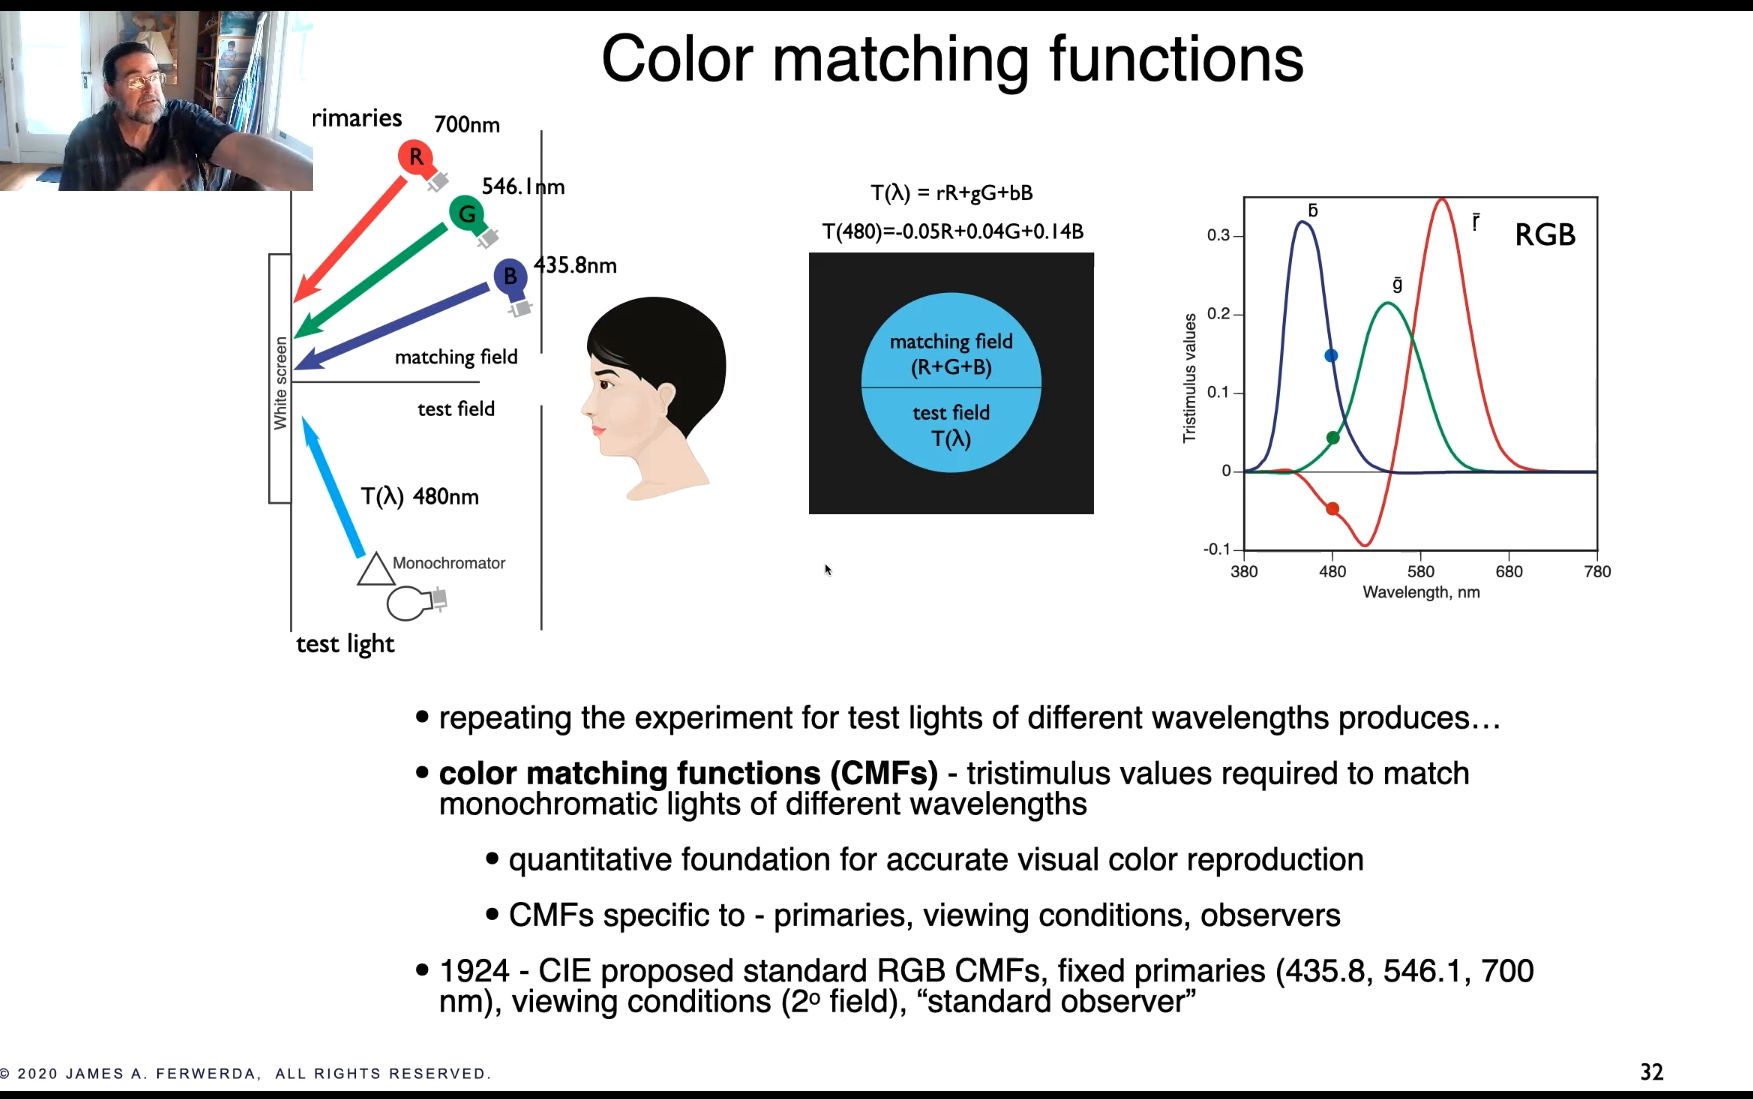
The R, G and B color curves represent the same thing, but for physically realizable light. The values for the R, G and B function were determined by the below experiment.
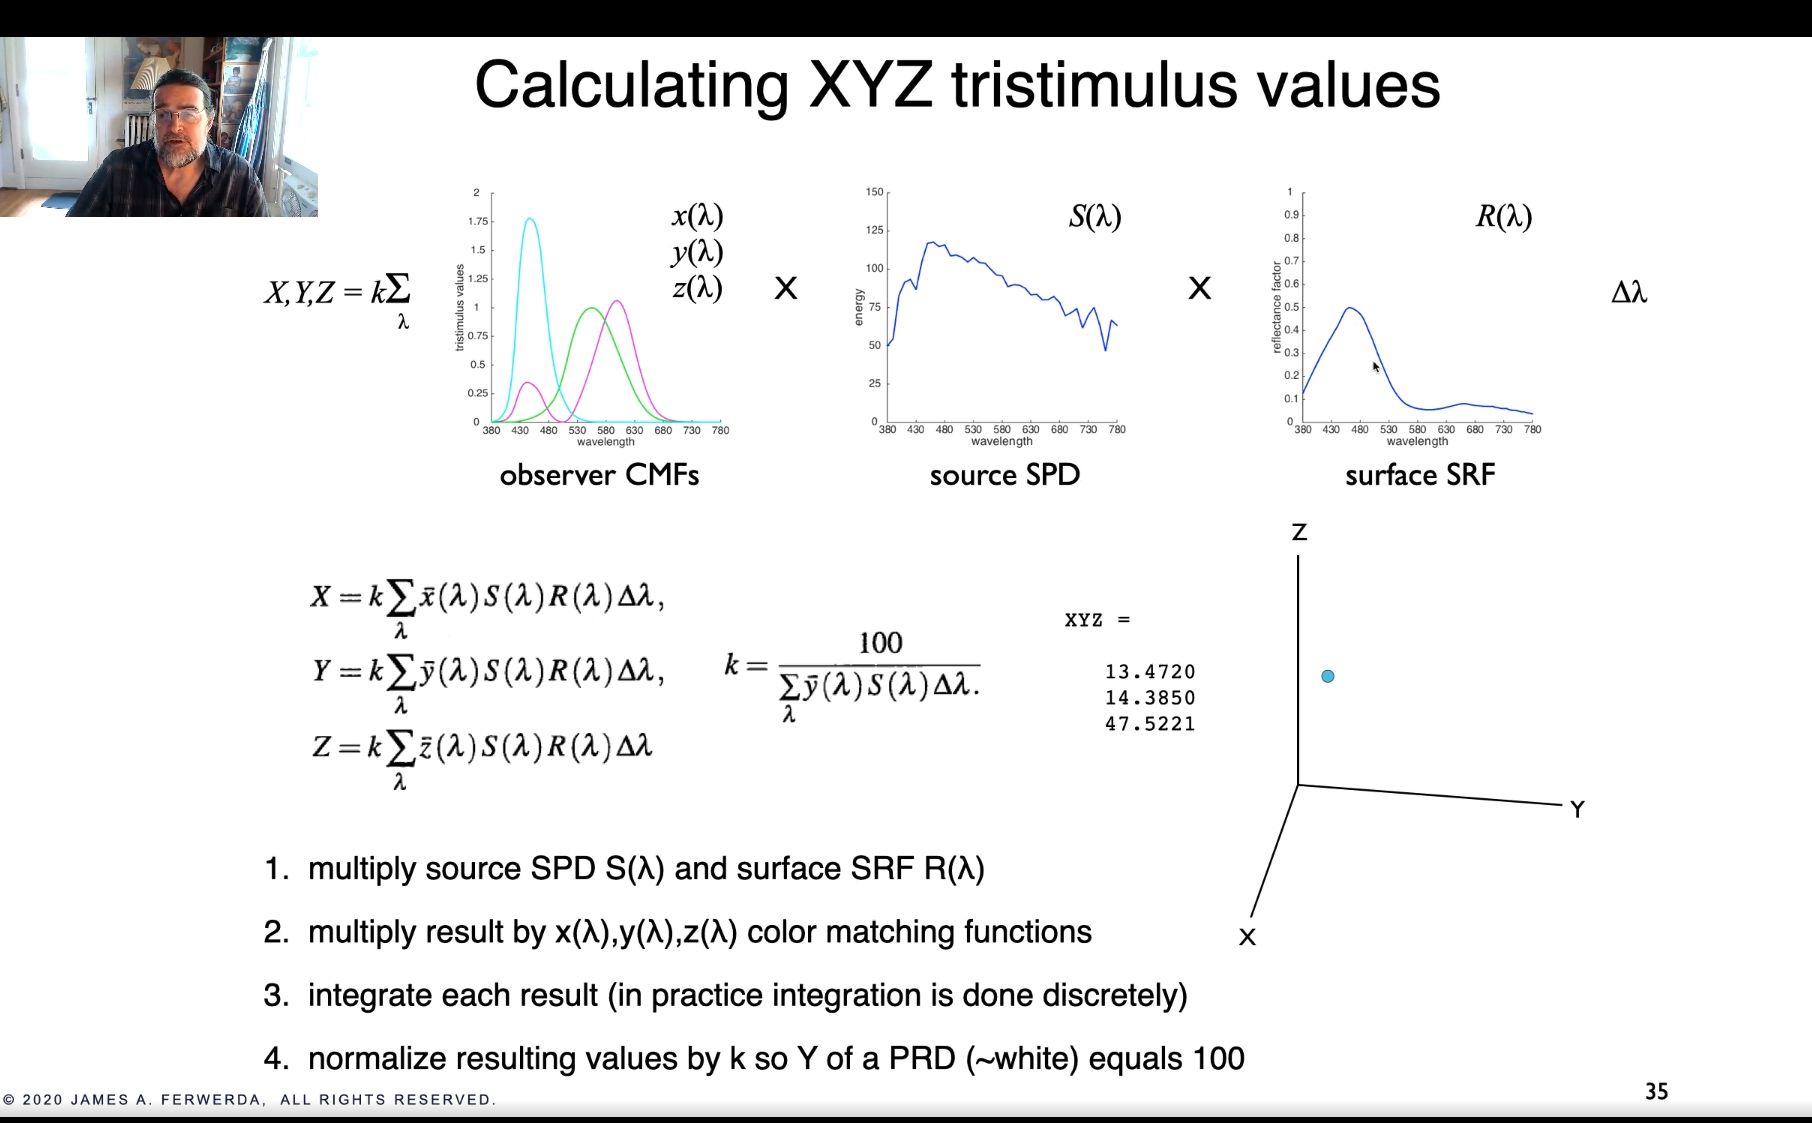
Calculating XYZ values
You can calculate the XYZ values for some arbitrary light source if you know:
- the spectral power distribution of this light source (the source SPD)
- the surface spectral reflectance function (SRF)
- the official XYZ function values